← All courses

Power BI

Build interactive dashboards and reports with Power BI, DAX and Power Query.

  • 1 month (4 weeks)
  • 20 topics
  • Final exam
Book a trainer
Power BI

Your learning path

4 weeks from start to certificate

  1. 1

    Week 1

    Power BI basics

  2. 2

    Week 2

    Power Query

  3. 3

    Week 3

    DAX

  4. 4

    Week 4

    Publish & share

  5. Finish

    Exam & certificate

Every week

How each week works

Learn

Live class with your trainer

Practice

Guided hands-on exercises

Build

Mini project for your portfolio

Review

Feedback and Q&A

Concept lab

See how the core concepts connect

Follow the path from foundations to real workplace application. Every concept feeds the next project.

1

Week 1

Introduction to Power BI Ecosystem

2

Week 1

Connecting to Data Sources

3

Week 2

Power Query Editor Interface

4

Week 2

Data Cleaning Techniques

5

Week 3

DAX Fundamentals

6

Week 3

Aggregation Functions

7

Week 4

Power BI Service Overview

8

Week 4

Creating Dashboards

Topics per week

20 topics · 80 lessons
Week 15
Week 25
Week 35
Week 45

Course curriculum

1

Week 1 · 5 topics · 20 lessons

Power BI basics

By the end of this week: Learners will be able to connect to data sources, perform basic data cleaning, and create fundamental visualizations and reports within Power BI Desktop.

  1. 1.1Introduction to Power BI Ecosystem
    • What is Power BI?
    • Power BI Desktop vs. Service
    • Key components and workflow
    • Understanding data analysis lifecycle
  2. 1.2Connecting to Data Sources
    • Importing data from Excel/CSV
    • Connecting to SQL Server
    • Web data and Folder sources
    • DirectQuery vs. Import mode
  3. 1.3Data Modeling Fundamentals
    • Understanding relationships
    • Star schema vs. Snowflake
    • Creating and managing relationships
    • Cardinality and cross-filter direction
  4. 1.4Introduction to Visualizations
    • Bar charts and Column charts
    • Line charts and Area charts
    • Pie charts and Donut charts
    • Table and Matrix visuals
  5. 1.5Designing Basic Reports
    • Adding text and shapes
    • Formatting visuals and pages
    • Using slicers for filtering
    • Bookmarks for interactive views
Week 1
Power BI basics
Introduction to Power BI Ecosystem
Connecting to Data Sources
Data Modeling Fundamentals
Introduction to Visualizations
Designing Basic Reports

Hands-on project

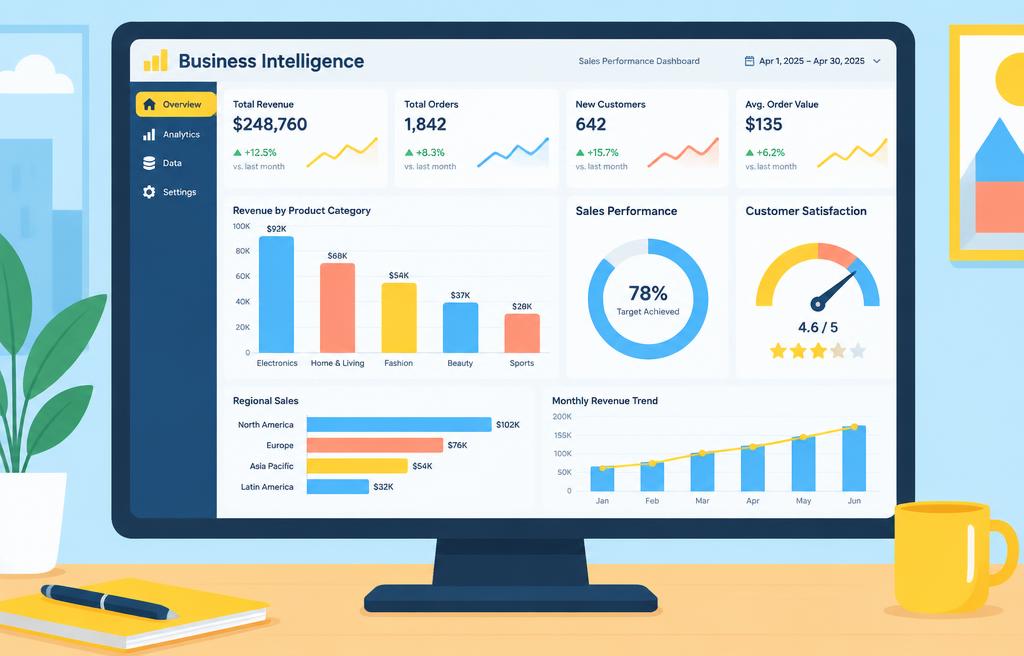
Create a Sales Performance Dashboard

2

Week 2 · 5 topics · 20 lessons

Power Query

By the end of this week: Learners will master Power Query for advanced data transformation, cleaning, and preparation, ensuring robust and reliable datasets for analysis.

  1. 2.1Power Query Editor Interface
    • Overview of the Editor
    • Applied Steps pane
    • Query Settings and Ribbon
    • M language basics (peek)
  2. 2.2Data Cleaning Techniques
    • Removing rows/columns
    • Handling nulls and errors
    • Changing data types
    • Text transformations (trim, split)
  3. 2.3Data Transformation Techniques
    • Pivoting and Unpivoting columns
    • Merging queries (joins)
    • Appending queries (unions)
    • Transposing tables
  4. 2.4Advanced Data Shaping
    • Conditional columns
    • Custom columns with M
    • Date and Time transformations
    • Grouping and aggregating data
  5. 2.5Best Practices in Power Query
    • Query folding concepts
    • Organizing queries into folders
    • Documenting steps and queries
    • Error handling strategies
Week 2
Power Query
Power Query Editor Interface
Data Cleaning Techniques
Data Transformation Techniques
Advanced Data Shaping
Best Practices in Power Query

Hands-on project

Clean and Transform Customer Data

3

Week 3 · 5 topics · 20 lessons

DAX

By the end of this week: Learners will be proficient in writing complex DAX formulas to create calculated columns, measures, and tables, enabling sophisticated analytical capabilities.

  1. 3.1DAX Fundamentals
    • What is DAX?
    • Calculated Columns vs. Measures
    • Evaluation Context (Row/Filter)
    • Basic DAX syntax and operators
  2. 3.2Aggregation Functions
    • SUM, AVERAGE, MIN, MAX
    • COUNT, DISTINCTCOUNT
    • SUMX, AVERAGEX (iterators)
    • CALCULATE function basics
  3. 3.3Filter Context Modification
    • ALL, ALLSELECTED
    • ALLEXCEPT, REMOVEFILTERS
    • KEEPFILTERS, CALCULATETABLE
    • Understanding context transitions
  4. 3.4Time Intelligence Functions
    • DATEADD, SAMEPERIODLASTYEAR
    • TOTALYTD, TOTALQTD, TOTALMTD
    • DATESBETWEEN, DATESINPERIOD
    • Creating a date table
  5. 3.5Advanced DAX Patterns
    • RANKX and Top N analysis
    • VAR keyword for readability
    • Understanding relationships in DAX
    • Best practices for DAX performance
Week 3
DAX
DAX Fundamentals
Aggregation Functions
Filter Context Modification
Time Intelligence Functions
Advanced DAX Patterns

Hands-on project

Develop Key Performance Indicators (KPIs)

4

Week 4 · 5 topics · 20 lessons

Publish & share

By the end of this week: Learners will effectively publish reports to Power BI Service, manage security, create dashboards, and enable collaboration and deployment for end-users.

  1. 4.1Power BI Service Overview
    • Workspaces and Navigation
    • Publishing reports from Desktop
    • Data refresh in Service
    • Understanding content packs
  2. 4.2Creating Dashboards
    • Pinning visuals to dashboards
    • Q&A feature for natural language
    • Setting up data alerts
    • Dashboard themes and customization
  3. 4.3Sharing and Collaboration
    • Sharing reports and dashboards
    • Managing workspace access
    • Publishing Power BI Apps
    • Commenting and subscriptions
  4. 4.4Data Security and Governance
    • Row-Level Security (RLS)
    • Managing gateways for on-premise
    • Data sensitivity labels
    • Auditing and monitoring usage
  5. 4.5Deployment and Integration
    • Embedding Power BI reports
    • Power BI mobile apps
    • Exporting data from reports
    • Connecting to other Microsoft services
Week 4
Publish & share
Power BI Service Overview
Creating Dashboards
Sharing and Collaboration
Data Security and Governance
Deployment and Integration

Hands-on project

Publish and Share an Executive Dashboard

Final exam & certificate

Finish the 4 weeks, then take the online exam. Score 70% or more to pass.

Job-ready syllabus

Learn it. Build it. Explain it. Use it.

The syllabus goes beyond watching lessons. You practice the tasks employers expect, produce evidence of your skills, and prepare to discuss your work clearly.

Workplace skills

Apply Introduction to Power BI Ecosystem, Connecting to Data Sources, Data Modeling Fundamentals, Introduction to Visualizations in guided business scenarios.

Portfolio proof

Complete 4 practical projects, including Create a Sales Performance Dashboard.

Professional practice

Present your work, respond to feedback, document decisions, and improve the final result.

Interview readiness

Review common role questions and explain your process, tools, trade-offs, and project outcomes.

Your completion pack

Weekly projects, trainer feedback, final assessment, and a certificate you can add to your résumé and LinkedIn profile.

Why learn from us?

Six reasons students pick M - IT Solutions

One-month programs built around live teaching, real projects and support that actually shows up.

Live online classes

Learn with a real instructor in real time — not pre-recorded videos you watch alone.

Hands-on projects

Every week ends with practical work you can show employers on day one.

1-on-1 trainer time

Stuck or want to go deeper? Book private sessions with a trainer whenever you need.

A real learning area

Lessons, progress tracking and exams all live in your account, on any device.

Trusted by companies

We train individuals and whole teams — from small businesses to enterprise programs.

Verified & supported

Verified accounts, real certificates and a support team that answers when you write.

1000+ learners trainedLive, instructor-ledProject-based every week
Home